
This article is part of our Whole Picture of Public Education project, which uses state and national data to answer the question: what influences student learning? For more information, visit www.ReachingHigherNH.org/wholepic
In our The Whole Picture of Public Education series, we’ve been exploring what influences student learning in New Hampshire. We found that family income is the best predictor of student proficiency in elementary school, but that as students get older, their community becomes an additional predictor of proficiency.
In addition to these factors, average teacher salary was a strong predictor of student outcomes in secondary schools, especially in eleventh grade. Districts with higher teacher salaries tended to have higher proficiency rates in reading and math, in all three grades included in our study.
However, teacher salaries vary widely across New Hampshire. Districts with higher property wealth and stronger economic conditions tended to have higher teacher salaries, and the pay gap has increased 50% over the past ten years.
Examining findings
Districts that had higher teacher salaries outperformed their counterparts with lower paid educators in both reading and math. This relationship was strongest in eleventh grade, but was significant across all three grades included in our study.
The graph below shows each district’s student proficiency rates for math and reading, and the average teacher salary of the district. The first graph shows districts’ fourth grade proficiency rates, followed by eighth grade and eleventh grade proficiency rates.
Find your district below, using the search box in the upper right corner:

Additionally, higher teacher salaries were associated with higher graduation rates, displayed in Table 2 below.

It is important to note, however, that there are quite a few variables we were not able to analyze when considering teachers, as the data is not currently available from the New Hampshire Department of Education. Those variables included teacher retention and attrition within districts; whether the teacher demographics of a district reflect the student demographics; the number of years in the field; and degrees and certifications in relation to teacher salary, to name a few.
Teacher salary and cost per student
Discussions about teacher salary often go hand-in-hand with concerns about the rising costs of educating students. And yet, our research shows that in New Hampshire, there was no relationship between teacher salary and cost per student. While it may be true that personnel costs are a substantial part of a school district’s budget, we found no relationship between the cost per student and average teacher salary.
Geographical Differences

In New Hampshire, the amount that districts pay teachers tends to differ based on socioeconomic status and property wealth.
School budgets are formed by each individual district, and unlike some other states, New Hampshire does not have a minimum teacher salary.
Districts with higher property wealth and stronger economic conditions tended to have higher teacher salaries, and this trend has grown over time.
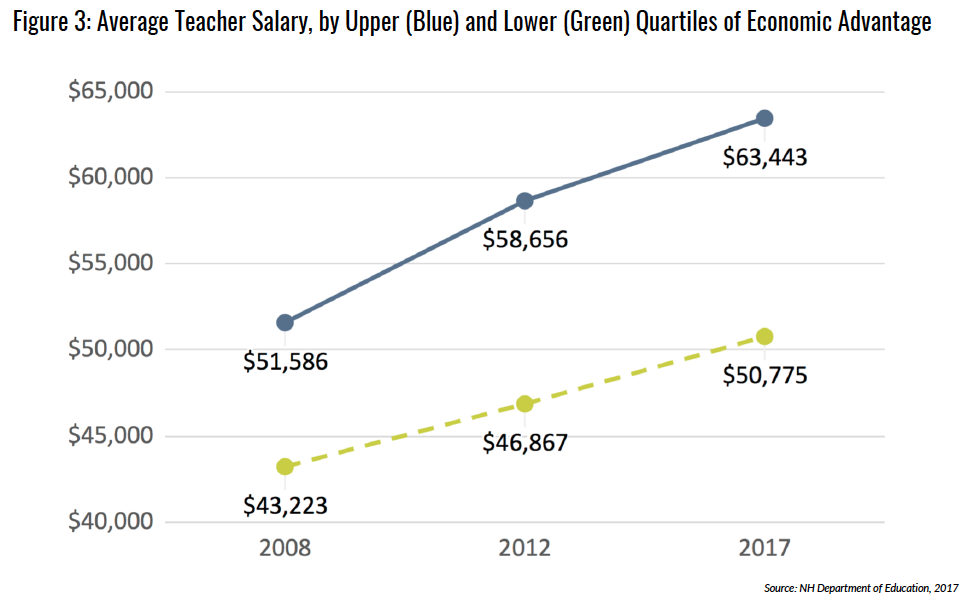
Figure 3 demonstrates average teacher salary in two groups: the “upper quartile,” which are the 32 districts where less than 12% of students are navigating poverty in 2017 (depicted by the blue line), and the “lower quartile,” which are the 32 districts where more than 36% of students are navigating poverty in the same year (depicted by the green line). As shown in Figure 3, the difference in average teacher salary between these two groups of districts grew by 51% between 2008 and 2017. In 2008, districts with fewer students navigating poverty paid their teachers about $8,000 more than districts with higher concentrations of students navigating poverty. In 2017, the difference grew to over $12,000.
School administrators in districts that are unable to offer higher salaries often say that they have difficulty retaining teachers. High rates of teacher turnover have negative effects on student learning, particularly in math and English Language Arts (ELA), and these effects are stronger in more economically vulnerable districts.
This is the fourth part of our comprehensive analysis on student learning in New Hampshire, called The Whole Picture of Public Education. Check out more of our series:
- Part one: What influences student learning in New Hampshire?
- Part two: How economic security affects our youngest learners
- Part three: Harnessing the power of our communities for the benefit of our students
Check out our other resources and tools:
- A comprehensive report, which uses five stories of New Hampshire families to guide readers through the project’s core findings and encourages them to consider their real-life implications;
- Interactive data visualizations, which allow users to explore and ask questions of the data;
- Community and school district profiles, which help individuals build a better understanding of their own communities (to be released soon); and,
- The methodology of the study, including appendices for our statistical models.


You must be logged in to post a comment.